Power of You(th) data
After conducting our Power of You(th) Program on the Eastern half of Missouri, we would hand out an anonymous survey to those participants in grades 8-12. We have been conducting this survey for the past 10 months and have reached many different students since then. Collecting this data assists us in shaping our program to benefit our direct population in the best way possible. We also like to provide this data to our grantors so they gather a better understanding of how we all are impacting and shaping our youth for the better. Below you will find our data presented in pie charts for many different questions we have asked. Due to the survey being a paper survey, these students are not forced into answering these questions and may choose to leave some answers blank. Because of this, you may find that not all pie charts equal up to the perfect 100%.
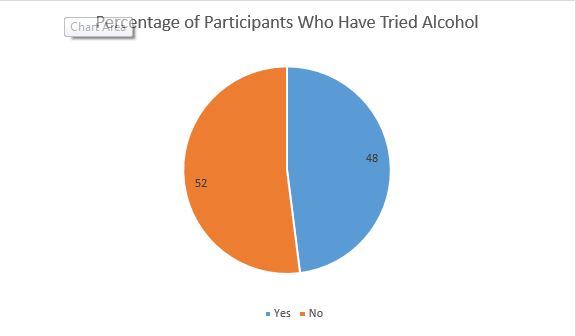
48% of participants have stated that have tried alcohol underage. 52% have stated that have not tried alcohol underage.
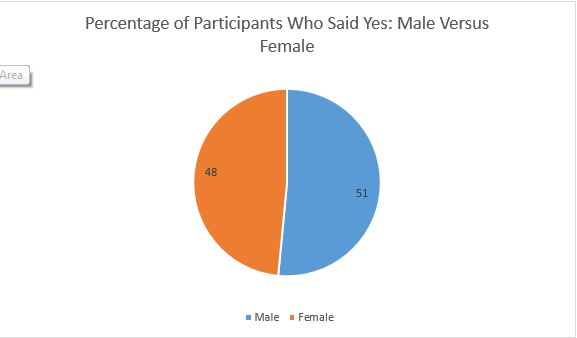
51% of the participants who answered yes identified as “male”. 48% of participants who answered yes identified as “female”.
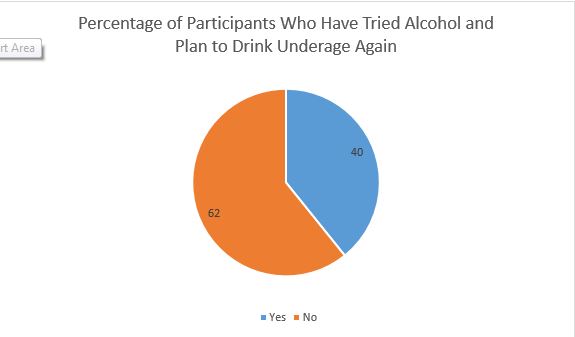
40% of participants who answered “yes” to consuming alcohol underage stated they would consume alcohol underage again. 62% of participants who answered “yes” to consuming alcohol underage stated they would not consume alcohol underage again.
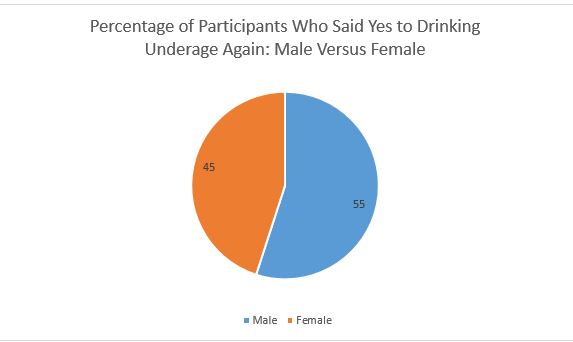
55% of the participants who answered “yes” to consuming alcohol again underage identified as “male”. 45% of the participants who answered “yes” to consuming alcohol again underage identified as “female”.
48% of participants who answered “no” to consuming alcohol underage again identified as “male”. 50% of participants who answered “no” to consuming alcohol underage again identified as “female”.
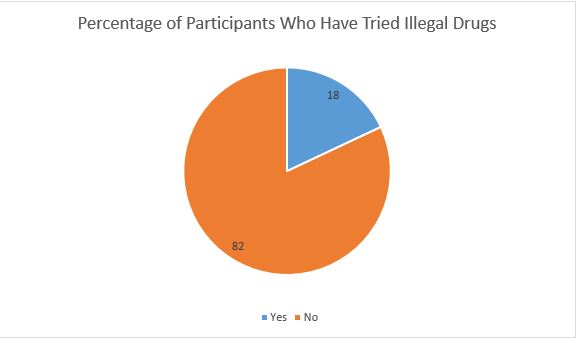
18% of participants answered “yes” to consuming illegal drugs. 82% of participants answered “no” to consuming illegal drugs.
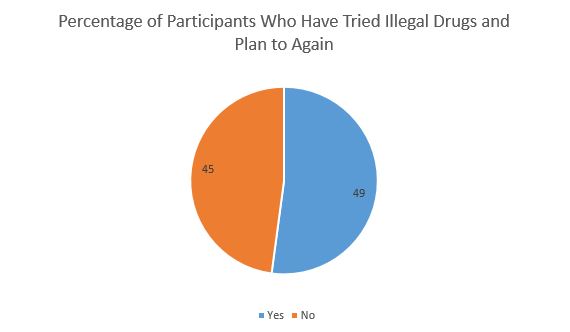
49% of participants who answered “yes” to consuming illegal drugs stated they would consume illegal drugs again. 45% of participants who answered “yes” to consuming illegal drugs stated they would not consume illegal drugs again.
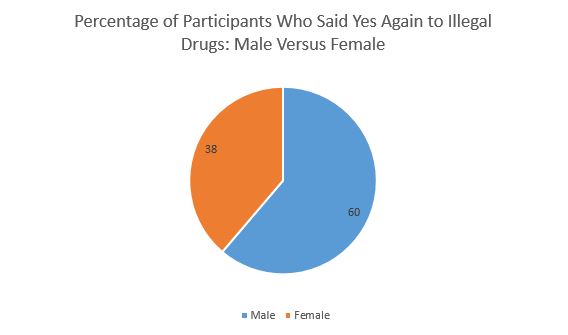
60% of the participants who answered “yes” to consuming illegal drugs again identified as “male”. 38% of the participants who answered “yes” to consuming illegal drugs again identified as “female”.
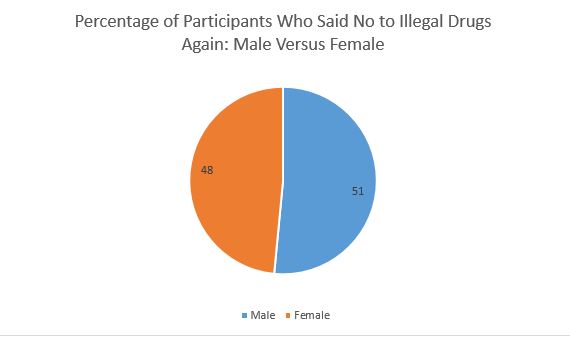
51% of participants who answered “no” to consuming illegal drugs again identified as “male”. 48% of participants who answered “no” to consuming illegal drugs again identified as “female”.
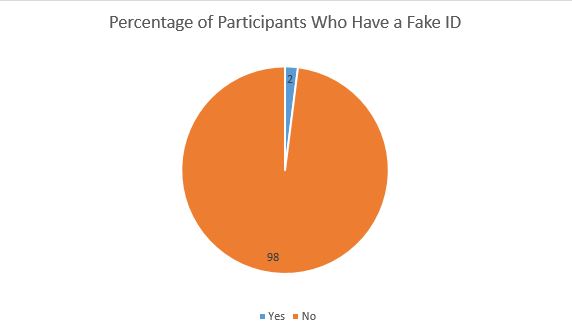
2% of participants answered “yes” to having a fake ID. 98% of participants answered “no” to having a fake ID.
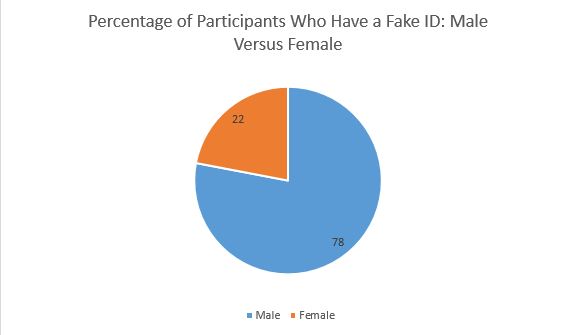
78% of participants who answered “yes” to having a fake ID identified as being “male”. 22% of participants who answered “yes” to having a fake ID identified as being “female”.
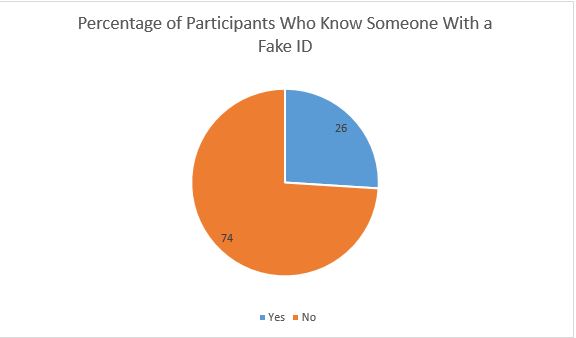
26% of participants answered “yes” to knowing someone who has a fake ID. 74% of participants answered “no” to knowing someone who has a fake ID.
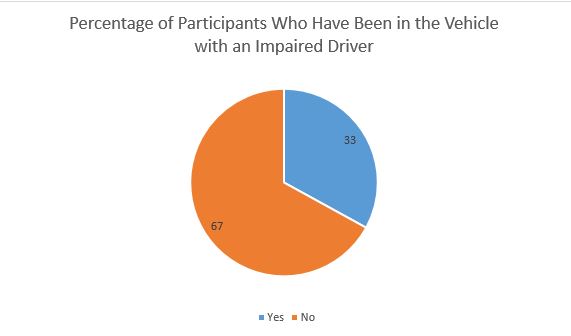
33% of participants answered “yes” to having rode in the vehicle with an impaired driver. 67% of participants answered “no” to having rode in the vehicle with an impaired driver.